At least half our clients come to us with data that’s disparate and out of synch. And they walk away smarter, faster—and with significantly higher revenue.
Gaining that kind of visibility and insight starts with exposing missing data and broken systems. Then optimizing your customer relationship management (CRM), marketing automation (MA) and campaign automation (CA) systems. Then by applying highly sophisticated filtering, so you can explore your data and analyze it in ambitious, flexible ways. We help you drill down into your data, even across multiple data sources.
Website Visitor Intelligence
Our website visitor intelligence services are an excellent complement to the activities of outbound marketers, internal sales executives, and also account managers. It provides valuable company-specific insight into research activity by page on your website, enabling your marketing and sales teams to tailor their early conversations with each prospect more closely to their specific needs by assessing their research history first.
Specifically, we enable you to track and store the web browsing history of every visitor that comes to your site – even when they don’t fill out an online form. This interaction history is tracked over time so that when a prospect does raise their hand and fill out a form, the full research history is available from every previous visit they have made.
We gather full visit history on each of your anonymous visitors including source, time of visits, number of visits, pages visited, time on site, and visit flow. Using reverse IP lookup, the solutions we implement provide you with full firmographic data on every anonymous visitor, including company name, domain, location, industry, number of employees, annual revenue, and ownership (public or private). We can put anonymous visitors or target companies on a watch list, so when they do come to your website, alerts and workflows could be triggered for immediate action.
Customer Profiling & Personas
Before a business gets ahead with their sales and marketing strategies in the business markets, knowing their customer is one of the first pre-requisite in the same context. This is where efficient customer profiling helps you in ascertaining “who are your best customers” and “where to head finding more like them”. To accomplish this, we create certain specific segments of your customers based on several specific characteristics. These characteristics can be their age, geographical location, preference, along with other impactful demographics. We also take it a layer deeper by segregating your customer base using more information such as site and app usage behavior, content consumption patterns, lead scores, and more. This is where accurate and efficient customer profiling comes into full focus, enabling you to bring the right leads into your funnel, driving your business’s future growth through increased engagement and conversions.
BI Dashboards & Reporting
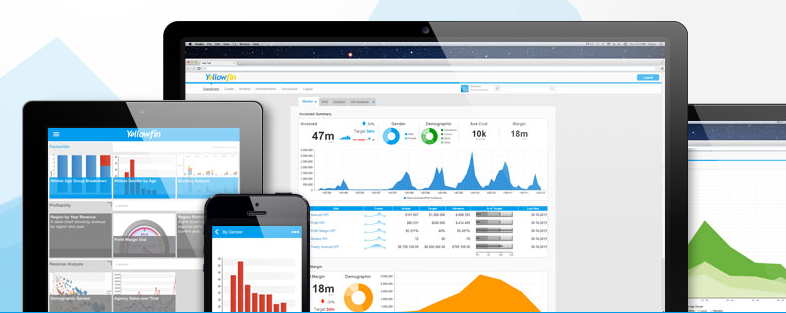
A business intelligence dashboard, or BI dashboard, is a data visualization and analysis tool that displays on one screen the status of key performance indicators (KPIs) and other important business metrics and data points for an organization, department, team, or process. These dashboards are widely used by corporate executives, business managers, and sales and marketing teams. A sales dashboard includes data on product or retail sales, the cost of sales operations, and other KPIs, enabling users to track progress against sales goals and identify potential trouble spots. Similarly, a marketing dashboard contains data on costs, response rates, lead generation, and other marketing metrics.
Xcel Agency can help your organization with procurement, implementation, and management of your BI Dashboard in the following ways:
- Software vendor selection. Major vendors of modern analytics and BI platforms all offer BI dashboards and dashboard design tools as part of their product lineups. That includes Tableau, Microsoft, Qlik, IBM, MicroStrategy, Oracle, SAP, SAS, Sisense, Tibco, and Salesforce, which now owns Tableau. We help you navigate the product landscape to select the tool that best fits your business needs.
- Connections to data sources. Depending on the data that users need to see, BI dashboards can be connected to data warehouses, data marts, and data lakes — the most common analytics data stores — or to operational systems, industrial equipment, and external data feeds for more up-to-date information.
- Data visualizations. Dashboards can be configured with various types of data visualizations to show different performance metrics, statistics, and other information. Supported visualizations range from the basic line and bar charts to more elaborate graphics, such as bubble charts, heat maps and scatter plots.
- Data tables. BI dashboards may also incorporate tables of data that provide an at-a-glance look at relevant data values. The tabular data often includes color-coding or other graphical treatments to highlight specific information — for example, to flag a decline in sales or financial losses.
- Drill-down capabilities. This feature enables users to get more information or look at and analyze detailed data by clicking on a data visualization. Doing so takes them to additional visualizations or data tables, often arranged in a hierarchical fashion so people can drill down multiple levels if they want to.
- Data filters. Another interactive feature, filters enable users to customize date and time ranges, geographic settings, and other parameters in data visualizations to get a more focused view of the information being presented.

